Scope: steps to see a line graph with the total number of text messages sent each month. This bar chart indicates how many texts have been sent since you started using Teachers2Parents Text.
- Click on ‘reporting’ in the left-hand navigation pane

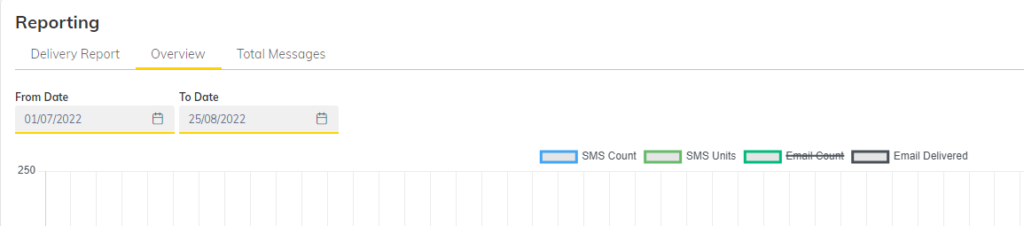
2. Selecting the ‘overview’ tab and using the date drop-down and selecting from and to dates in the calendar will auto-populate the line graph.

3. You are able to deselect the SMS count, SMS unit, email count and email unit and doing so will alter the results in the line graph.
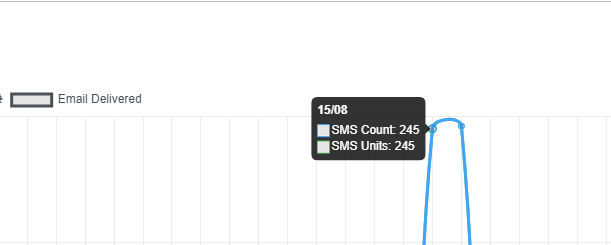
4. Hovering over the line of the line graph will display the exact volume of SMS or email (dependent on which metric you are looking at.